Introduction
As industrial policy reemerges as a central tool of economic strategy, understanding how economies invest, innovate, and generate value across sectors is critical. To see whether these policies are actually achieving their goals, we need to look at indicators that dig beneath the surface of the economy, providing insights into longer-term dynamics and structural change.
As part of its efforts to track Canada’s industrial performance, the Centre for Industrial Policy has launched a new Measuring What Matters dashboard, which collects nine initial indicators that illustrate the “Act, Realize, Achieve” framework introduced in the Centre’s paper, Canada at the Frontier, by Bentley Allan. At the heart of the framework are concrete, measurable outcomes that well-designed and well-executed industrial policy should produce. These outcomes consist of mechanisms and targets, and the framework lists some key areas for each of these.
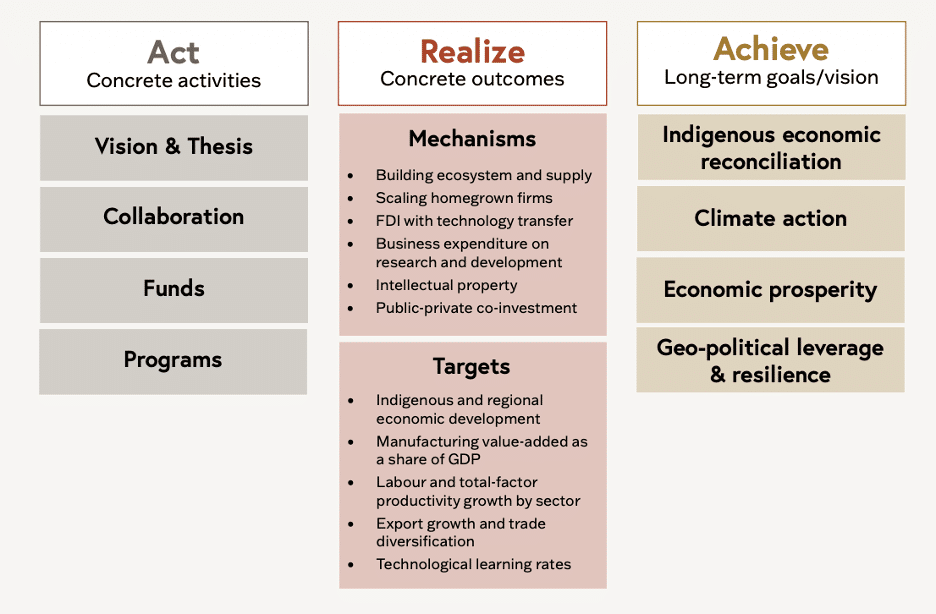
Mechanisms are the intermediate outcomes through which industrial policy is thought to generate its broader effects, and targets are economic indicators that provide the broadest view of structural change in the economy. In this post, we have included indicators that correspond to three mechanisms (business expenditure on research and development, gross capital formation, and manufacturing value-add) and two targets (economic complexity and labour productivity).
The initial indicators in the Measuring What Matters dashboard have been selected as they are both particularly meaningful and readily available, including for relevant peer economies, providing a clear overview of Canada’s current situation and how it compares with others. In general, the data presented in the dashboard reveals a growing divergence within the Canadian economy. While some resource-based sectors are capturing more domestic value and attracting investment, there are signs of sustained erosion in manufacturing and many advanced industries such as automotive.
The rest of this post outlines six storylines we see emerging from the noise of broader economic data. It’s a starting point for discussion, and the CIP team will work to continue to build out the dashboard using the framework as a guide. We hope you’ll explore the dashboard to uncover your own insights.
1. The Sweet Spot that Canada is Drifting Away From
Metric 1: Economic complexity ranking and score for selected middle power economies
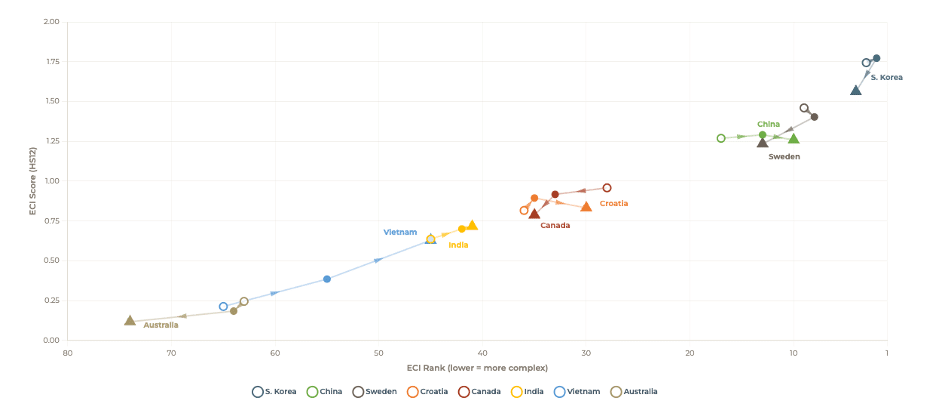
Economic Complexity Index Rank and Score Trajectories, 2015-2024, from Centre for Industrial Policy’s Measuring What Matters tool
Data source: Growth Lab, Harvard University · Atlas of Economic Complexity
The most competitive middle powers sit at the intersection of high-value natural resources and sophisticated manufacturing. In 2015, Canada was positioned exactly in that sweet spot between resource extraction and advanced domestic production. Its economy was dominated by two large and relatively balanced pillars, mineral fuels and automotive production, complemented with strong advanced manufacturing and globally competitive mining activity. This diversified structure translated into a ranking of 28th out of 146 on the Economic Complexity Index (ECI), a proxy for the knowledge intensity embedded in an economy’s productive capabilities (Harvard Growth Lab, Atlas of Economic Complexity).
In the decade since, Canada has seen a shift not just in relative performance, but structural composition. By 2024, Canada’s ECI had dropped substantially, and its ranking had slipped to 35th, reflecting the steady erosion of manufacturing ability and increasing concentration on resource-based exports. While mineral fuels have increased their share of total exports, sectors associated with higher complexity — particularly machinery, electronics, and certain advanced manufacturing segments — have stagnated or declined.
This matters because economic complexity is predictive. Economies that produce a wider range of sophisticated goods tend to exhibit stronger long-term growth trajectories, because complex industries depend on and reinforce research capacity, innovation systems, skilled labour, and higher-value domestic production (Hausmann et al., 2014). Those same capabilities are also central to the future economy, where clean technology, electrification, advanced materials, and digital infrastructure increasingly rely on complex goods rather than raw inputs alone.
This divergence becomes clearer when we compare Canada to other economies over the same period. Countries such as India and Vietnam have moved decisively up the complexity ladder in that time, with Vietnam’s ECI more than doubling and India’s ECI almost equalling Canada’s. Their growth strategies have emphasized integration into global value chains, scaling of manufacturing capabilities, and gradual movement into more technologically complex exports. In contrast, Canada’s export basket has become less diversified and more exposed to commodity cycles.
This structural shift has implications for future growth. The Harvard Growth Lab’s projections place Canada near the bottom, 115th out of 144 countries in expected growth potential, based on the nation’s current export mix. The signal is not about current performance, but about trajectory: Canada’s economy is not as well-positioned as many of its peers to transition into new, higher-value sectors (Growth Lab, 2023 projections).
In effect, Canada is moving away from the intersection that defines competitive middle powers. The long-term risk is not resource dependence itself, but the gradual loss of the capabilities that allow an economy to convert resources into complexity, and complexity into growth.
2. The R&D Deficit
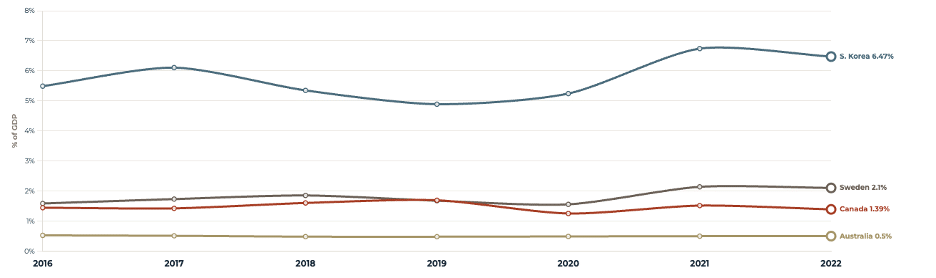
Metric 2: Business Enterprise R&D Expenditure (BERD) (% of GDP), 2017–2023
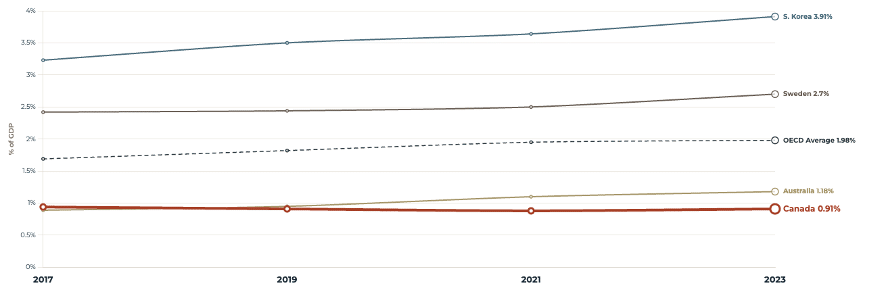
Source: OECD MSTI Database
Complexity doesn’t decline by accident. It declines when businesses stop investing in the knowledge that produces it. Businesses in both Canada and Australia spend about half of the OECD average on R&D as a percentage of GDP. The data shows a deeper sectoral concern: since 2001, BERD intensity in Canada has fallen by roughly 64% in manufacturing; 75% in pharmaceuticals; 87% in computer, electronic, and optical products; and 59% in aerospace — all industries that are closely tied to future industrial competitiveness.
Recent analysis from the Information Technology and Innovation Foundation (ITIF) argues that Canada’s weakness is not primarily that too few firms conduct R&D, but that too few firms reach the scale where R&D becomes globally significant. In 2024, Canadian firms accounted for only 1% of global advanced-industry R&D among the world’s top corporate R&D investors (Zhang, 2026). This aligns with the argument that Canada faces both a “scale-up problem” and a “technological dependence problem,” where promising domestic capabilities too often fail to become globally competitive firms or supply chains (Southin et al., 2025). Other Canadian innovation analyses make a similar point: Canada has strong universities, talent, and research capacity, but has struggled to convert those strengths into sustained private sector investment and globally competitive firms (Telfer Knowledge Hub, 2021) (Checkpoint Research, 2025).
The decline is especially important because it is concentrated in the industries Canada needs most. Manufacturing R&D supports process innovation and productivity growth; electronic and optical products include many of the technologies at the centre of future industrial competition. Aerospace, one of Canada’s most globally recognized advanced industries, remains strategically important, especially as defence industrial policy creates new opportunities.
The broader story is clear: Canada does not lack scientific capacity. It lacks enough business investment at industrial scale. The result is a widening gap between research potential and economic performance.
3. Losing Value Added from Manufacturing Exports
Metric 3: Domestic Value Added Content of Gross Exports by Sector, 2015 and 2022
Hollow circles = 2015 · Filled circles = 2022
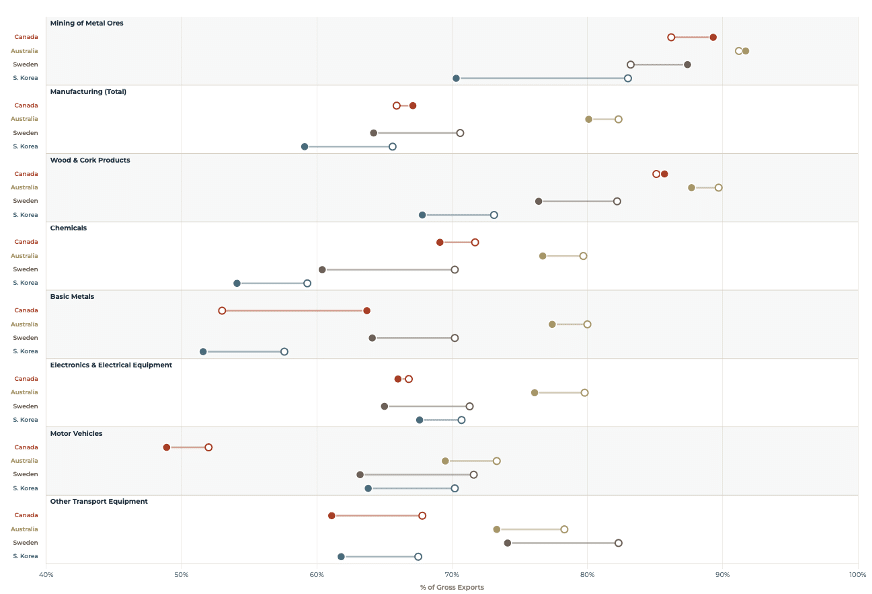
Source: OECD TiVA Database
As a small, open economy, Canada’s role in manufacturing is generally as part of internationally integrated value chains, particularly in a North American context. The challenge is to secure and hold a substantial share of domestic value added in exports generated in these sectors.
Across all manufacturing sectors, Canada generates a share of domestic value-added content within its exports that is comparable to Sweden and South Korea, which have seen considerable declines from 2015 to 2022. Across specific industries, the picture for Canada is mixed. Some areas involving advanced manufacturing, such as vehicles and transportation equipment or production of chemicals, have experienced a loss in domestic value added. On the other hand, industries based on transformation of natural resources, including mining and wood products, remain relatively high, reflecting their ability to capture a portion of the resource rent. In particular, the processing of minerals into basic metals has generated much more domestic value added from its exports in 2022 compared to 2015, but still lags far behind Australia’s comparable mining and metals sector.
How much of this performance in the metals sector comes from enduring structural advantages like resource endowment, energy costs, and proximity to inputs, and how much is driven by cyclical commodity price booms and temporary supply chain shifts? Understanding this is important, but regardless, attention needs to be paid to the downstream manufacturing sectors that provide the basis for broader and more resilient economic growth by building on the natural resource assets.
4. The Real Investment Deficit
Metric 4: Gross Fixed Capital Formation (% of GDP) for Total Manufacturing 2016–2022
Source: World Bank, World Development Indicators · Gross Fixed Capital Formation (% of GDP) [NE.GDI.FTOT.ZS]
The challenges facing manufacturing are also clear in the sector’s capital formation. Korea consistently invests between 5% and 7% of GDP in manufacturing capital formation, while Canada sits closer to 1% to 1.5% (OECD National Accounts; World Bank World Development Indicators). Capital formation estimates represent the best available indication of investment in productive capacity.
The difference is even starker in the industries reshaping the global economy. In 2022, Canada invested only 0.06% of its GDP in computer, electronic, and optical manufacturing, while Korea invested almost 3%. Although Korea is widely recognized as a historical leader in this sector, the scale of the gap remains striking. The difference amounts to roughly a 45-to-1 ratio in one of the most important sectors for semiconductors, advanced electronics, defence systems, automation, and industrial productivity (OECD National Accounts).
This shows the core weakness underlying Canada’s industrial structure. Canada is strengthening its resource-based sectors, but it is not building the same capital depth in manufacturing sectors that convert resources, research, and technology into higher-value production. The mining sector demonstrates that Canada can still build areas of industrial strength. The manufacturing sector shows that this capacity is not being replicated broadly enough.
5. The Auto Sector Retreat
Metric 5: Manufacturing Value Added for Selected Sectors (% of GDP), 2016 and 2022
Hollow circles = 2015 · Filled circles = 2022
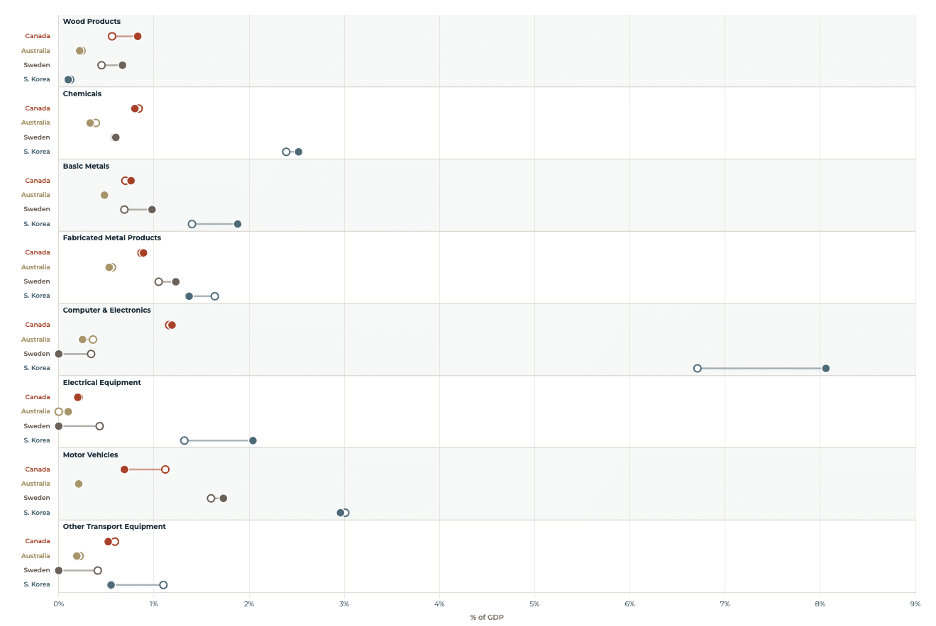
Source: UNIDO INDSTAT Revision 4
Automotive manufacturing has “out-sized strategic significance” because it coordinates advanced engineering, supplier systems, and export activity within regional production networks (Mordue and Meadowcroft, 2026). In Canada, the sector remains one of the country’s most integrated manufacturing ecosystems, with assembly operations anchoring a wider supplier base and supporting employment across supply and service networks. However, Canada’s subordinate role in North American value chains comes with vulnerabilities.
Canada’s auto sector shows what happens when capital depth and domestic production capacity weaken for long enough. Since 2016, motor vehicle value added has fallen 78%, while the broader motor vehicle sector is down 13%. The headline number is being held up by adjacent activity: automotive bodies, trailers, and semi-trailers are up 41%, and parts production has grown modestly by 11%.
Canada is not simply losing output in one industry. It is losing domestic content in a sector that historically helped organize the country’s broader manufacturing ecosystem. The auto sector is therefore an early warning signal for Canadian manufacturing. It shows how industrial decline can occur in a sector dependent on foreign-owned OEMs as supply chain anchors. Production shifts elsewhere, while Canada continues to consume advanced goods without retaining the same share of value, employment, supplier activity, and industrial learning.
6. Canada’s ICT Productivity Paradox
Metric 6: Labour Productivity for Information and Communication Sector (US$ Per Worker, PPP), 2017–2022
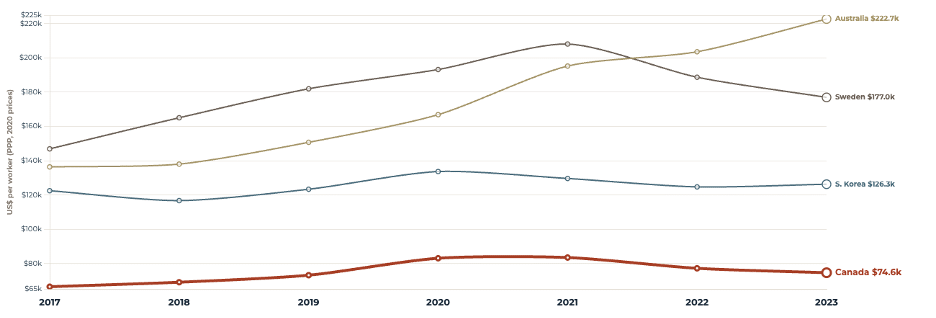
Source: OECD Regional Economics · Labour Productivity by Main Economic Activity
Canada’s industrial weakness ultimately shows up in productivity, and the ICT sector is one of the clearest examples. Canada does not lack digital activity, firms, or technical talent. The problem is that the structure of the sector does not generate enough output per worker. Much of Canada’s ICT activity is concentrated in software and computer services, while ICT manufacturing remains small and recently contracted (ISED, 2024). This matters because the ICT productivity is usually strongest where digital services are supported by scalable firms, strong intellectual property ownership, ICT-producing manufacturing, and capital-intensive infrastructure. In Canada, by contrast, the sector appears more weighted toward labour-intensive services and smaller firms. ISED reports that most Canadian ICT firms are concentrated in software and computer services, while ICT manufacturing accounts for only a small share of the sector and declined in 2024.
This is where the ICT story becomes especially revealing. Canada has a digital sector that governments routinely describe as central to the future economy. In 2024, ICT accounted for 6% of national GDP and contributed a fifth of Canada’s GDP growth between 2019 and 2024 (ISED, 2026). Yet the sector is not producing at the level of its peers. In 2023, Canada’s ICT sector produced roughly US$75,000 per worker, compared with about US$223,000 in Australia, nearly three times as much. After a brief COVID-era boost, Canadian ICT productivity has started to fall again, while Australia’s continues to climb.
That matters because productivity is the mechanism that provides the basis for turning industrial capacity into higher living standards. A country can add jobs, expand sectors, and grow headline GDP, but if output per worker does not rise, wage growth and competitiveness eventually become harder to sustain. Canada has digital firms and technical talent, but it is not yet turning those strengths into broad-based productivity growth.
Conclusion
These six storylines are only a starting point. They show why industrial data matters: beneath Canada’s headline economic numbers are deeper shifts in complexity, investment, domestic value, manufacturing capacity, and productivity. Some indicators point to natural resource strengths, especially in mining and metal ores. However, collectively they raise harder questions about whether Canada is building enough of the firms, technologies, and industrial capabilities needed for balanced long-term growth, diversification, and resilience.
That is the purpose of the Measuring What Matters dashboard: to make these signals easier to access and explore. The full dashboard allows users to explore the data behind these trends across countries, sectors, and indicators. Examining this evidence is necessary if policymakers, businesses, Indigenous groups, firms, and others are going to engage in an informed discussion about Canada’s economic future and the industrial strategies to secure it.
Sources
Bank of Canada. (2024, March 26). Time to break the glass: Fixing Canada’s productivity problem. https://www.bankofcanada.ca/2024/03/time-to-break-the-glass-fixing-canadas-productivity-problem/
Checkpoint Research. (2025, March 13). Canada’s R&D crisis: Bridging the innovation gap to stay competitive. https://checkpointresearch.ca/canadas-rd-crisis-bridging-the-innovation-gap-to-stay-competitive/
Chkir, I. (2021, May 12). Canada has everything it needs to innovate but fails to invest enough in R&D. Telfer School of Management, University of Ottawa. https://telfer.uottawa.ca/en/telfer-knowledge-hub/better-canada/canada-has-everything-it-needs-to-innovate-but-fails-to-invest-enough-in-r-d
Government of Canada. (2026). Canadian ICT sector profile 2024. Innovation, Science and Economic Development Canada. https://ised-isde.canada.ca/site/ised/en/research-and-business-intelligence/industry-sector-intelligence/technology-industries/digital-technologiesict/canadian-ict-sector-profile-2024
Government of Canada. (2026). Minerals economy. Natural Resources Canada. https://natural-resources.canada.ca/minerals-mining/mining-data-statistics-analysis/minerals-economy
Hausmann, R., Hidalgo, C. A., Bustos, S., Coscia, M., Chung, S., Jimenez, J., Simoes, A., & Yıldırım, M. A. (2011). The atlas of economic complexity: Mapping paths to prosperity. MIT Press. https://direct.mit.edu/books/oa-monograph/3014/The-Atlas-of-Economic-ComplexityMapping-Paths-to
Harvard Growth Lab. (n.d.). The atlas of economic complexity. Harvard Kennedy School. Retrieved April 30, 2026, from https://atlas.hks.harvard.edu/
Information and Communications Technology Council. (2026, March 3). Quarterly digital economy pulse: Digital adoption in Canada, March 2026. https://ictc-ctic.ca/reports/quarterly-digital-economy-pulse-digital-adoption-canada-march-2026
Innovation, Science and Economic Development Canada. (2025). Canadian ICT sector profile 2024. Government of Canada. https://ised-isde.canada.ca/site/ised/en/research-and-business-intelligence/industry-sector-intelligence/technology-industries/digital-technologiesict/canadian-ict-sector-profile-2024
Mordue, G., & Meadowcroft, J. (2026). Assembling Canada’s auto sector: Lessons from a century of industrial policy. Centre for Industrial Policy. https://centreforindustrialpolicy.ca/wp-content/uploads/2026/04/CIP_Assembling-Canadas-Auto-Sector_Digital.pdf
OECD. (2020, June 3). COVID-19 and Global Value Chains: Policy Options to Build More Resilient Production Networks https://www.oecd.org/content/dam/oecd/en/publications/reports/2020/06/covid-19-and-global-value-chains-policy-options-to-build-more-resilient-production-networks_f2e0f3b6/04934ef4-en.pdf
Southin, T., Allan, B., Bataille, C., Beck, M., Bernstein, M., Cosbey, A., Mehling, M., Olewiler, N., Samson, R., Sawyer, D., & Zvan, B. (2025). The right move at the right time: A new Canadian industrial strategy. Commission on Carbon Competitiveness & Transition Accelerator. https://transitionaccelerator.ca/wp-content/uploads/2025/06/C3-TA-Canadian-industry-strategy.pdf
Statistics Canada. (2026, March 24). Canada’s mining sector ramps up spending to power electric vehicles. https://www.statcan.gc.ca/o1/en/plus/9108-canadas-mining-sector-ramps-spending-power-electric-vehicles
Zhang, L. (2026, April 27). Canada’s missing R&D firms. Information Technology and Innovation Foundation. https://itif.org/publications/2026/04/27/canadas-missing-rd-firms/